Data Dashboards for Labels
Overview
Data Dashboards give your team a daily, detailed view of each artist: all releases, the performance of every song, revenue estimates, and the correlation between streaming activity and social media. Updated daily. No manual data pulls required.
This works for your own roster and for any other artist you are evaluating.
No integration work, no data sharing, and no existing relationship with us required. Dashboards are ready within 48 hours.
This page covers what is included, how each view works, and how your team can use it.
🎬 Watch it in action (1 min):
What Is Included
Your dashboard is built from the ISRCs, UPCs or Spotify Artist Links you provide. It pulls public streaming, social, and engagement data across Spotify, YouTube Videos, and TikTok, and generates revenue estimates across all DSPs using a proprietary calculation algorithm.
| Dashboard View | What It Shows | What You Can Do With It |
|---|---|---|
| Performance Overview | Revenue estimates, streaming metrics, TikTok creations, and time series across all your artists and platforms | See how your artists are performing at a glance. Identify revenue trends and streaming momentum over time. |
| Social Content | TikTok content feed ranked by engagement, benchmarked against each artist's baseline | Know which content is generating real traction before you spend on promotion. |
| Top Performers | Critical data and growth rates for your highest performing releases | Compare streams, views, revenue, and growth rates across your best releases in one place. Sort by growth, not just total revenue. |
| Track Details | Track-level drill-down with trends, metrics, and social content | Understand the full picture for any individual track. |
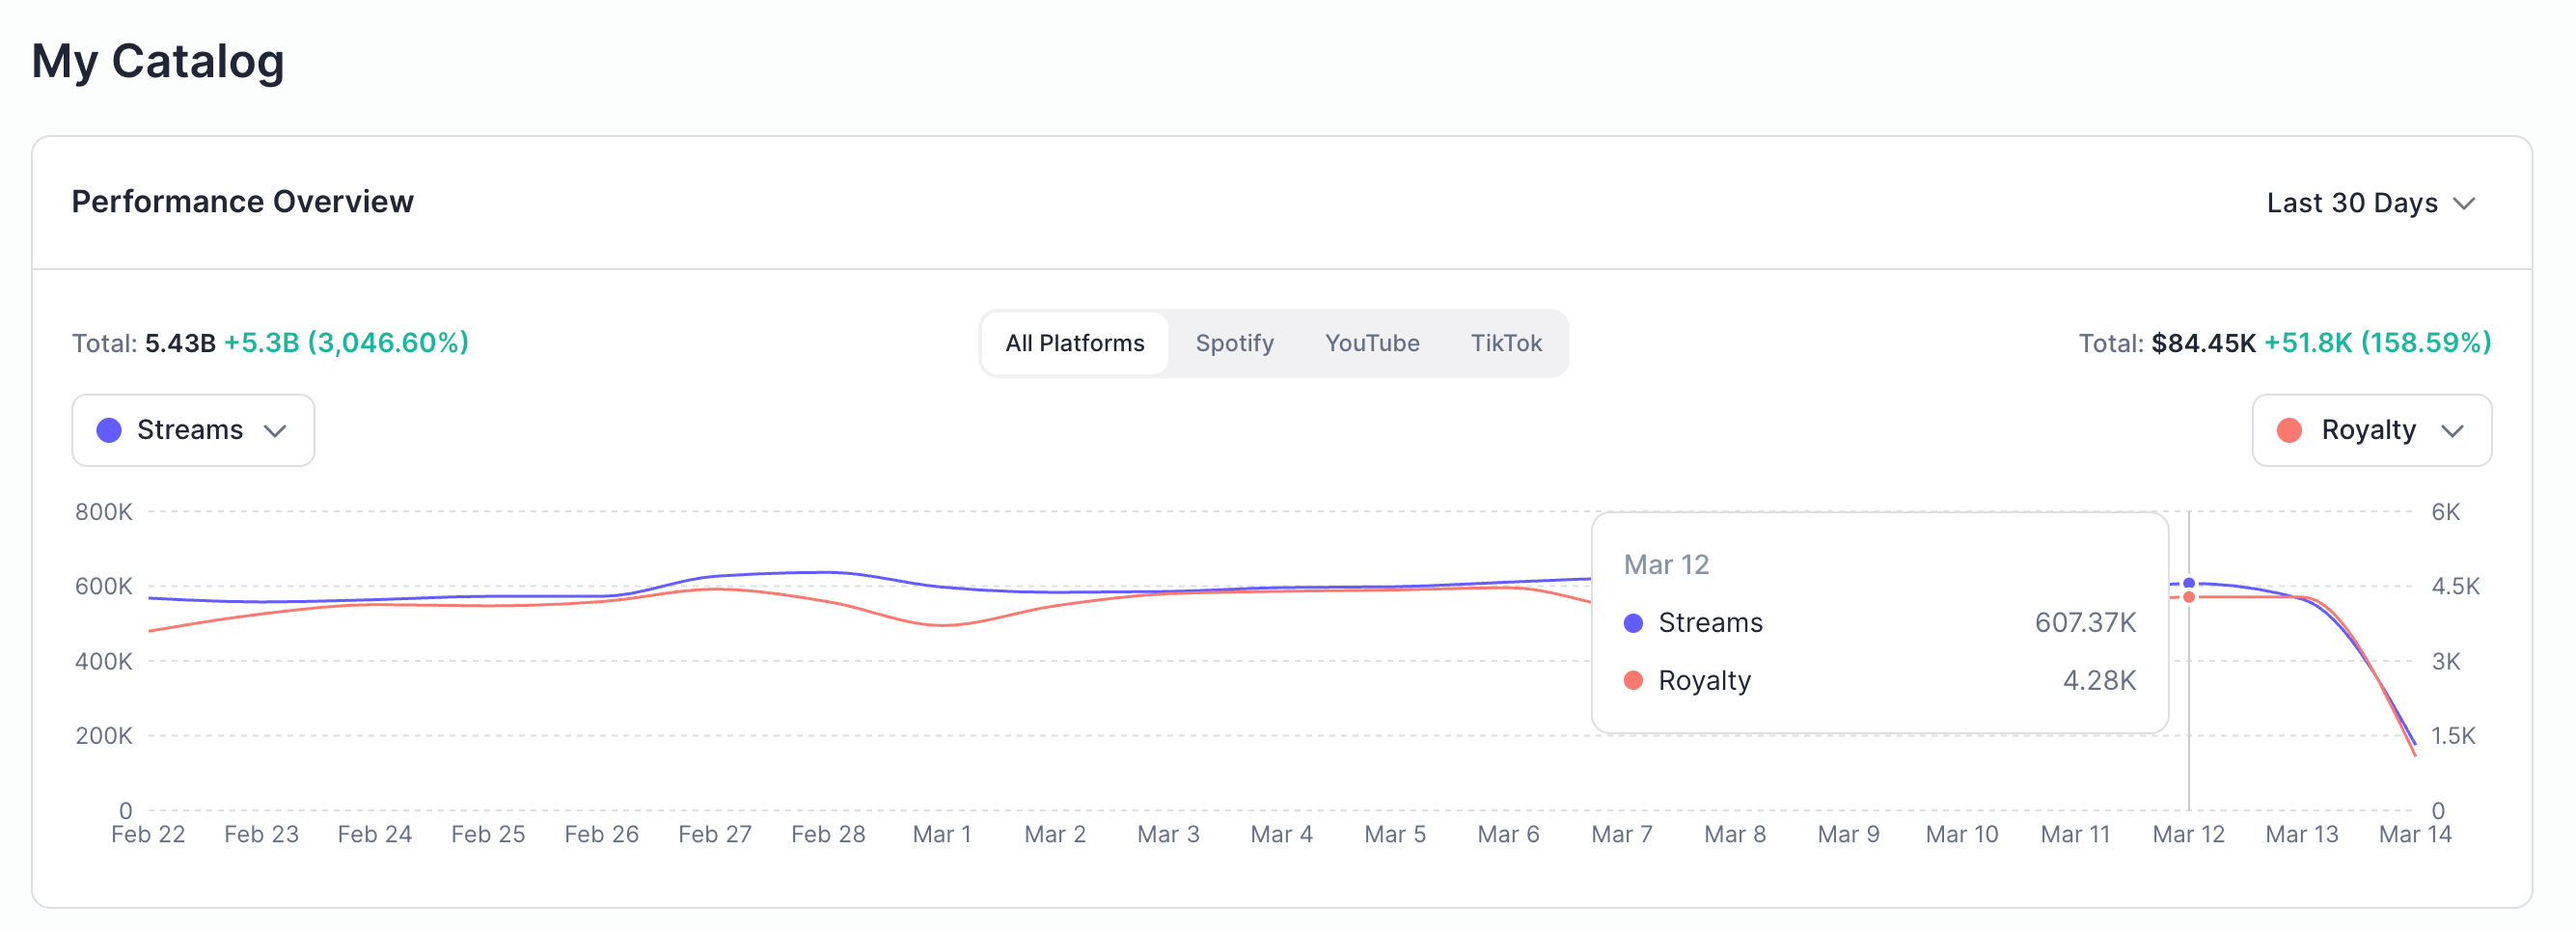
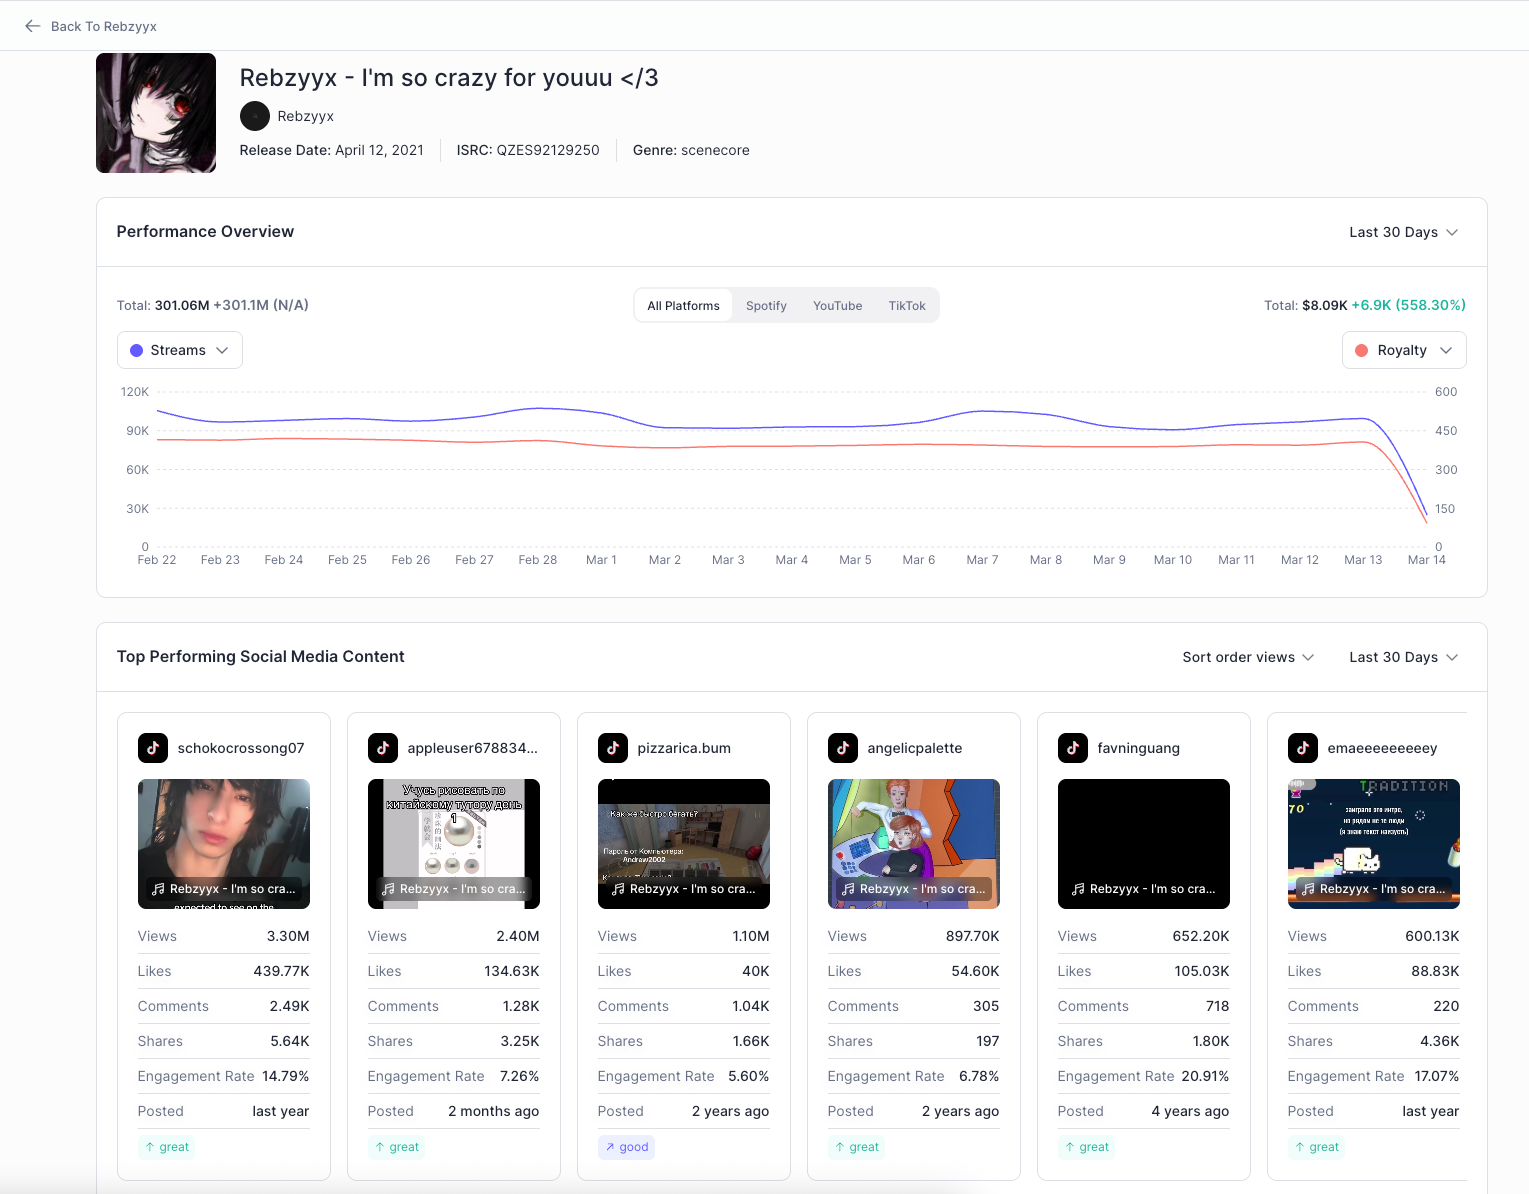
💰 Performance Overview and Revenue Estimates
Revenue estimates are generated from public streaming data using proprietary calculations. Updated daily. Visualized as a time series, so you see trajectory, not just a snapshot.
Estimates are available at the artist level as well as track level for every ISRC in your list. This gives your team an independent revenue picture alongside whatever your distributor provides.
🔬 About our revenue estimates. Our estimates are powered by 10 years of proprietary distribution data and 5 years of forecast model training. With access to distributor and public streaming data, our models translate real-time streams into revenue at 98% accuracy. Using public data alone, accuracy is in the 85% range. Once we receive official revenue statements from your catalog, we calibrate further and increase precision.
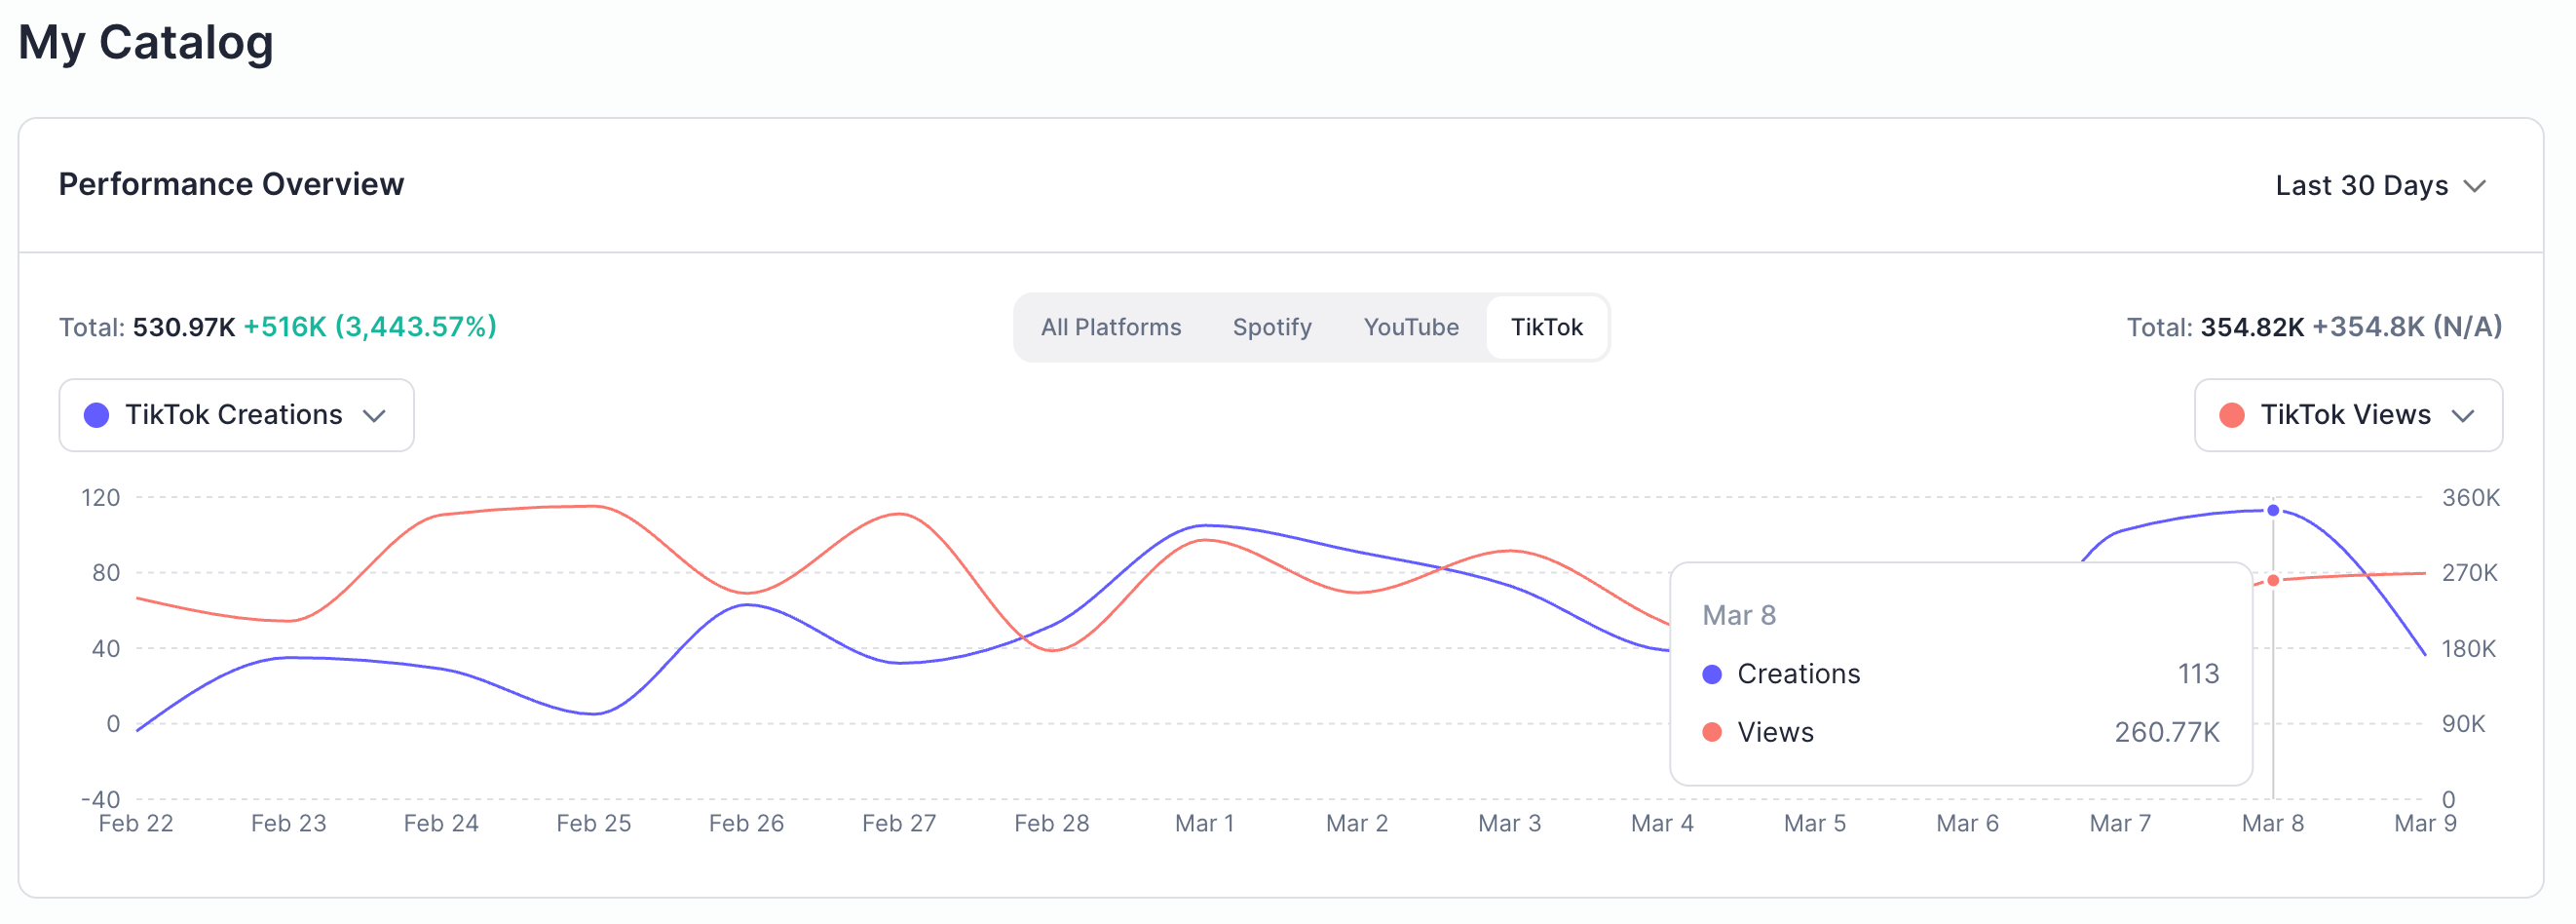
📈 Streaming and TikTok Performance
Spotify, YouTube, and TikTok data for every artist and release in your list. Total streams, daily streams, growth rates. Sortable, filterable, with time series charts for trend analysis.
Instead of pulling numbers from multiple platforms and stitching them together, everything is in one view. You can rank by revenue, not just stream count, and spot artists accelerating before they reach the top of the list.
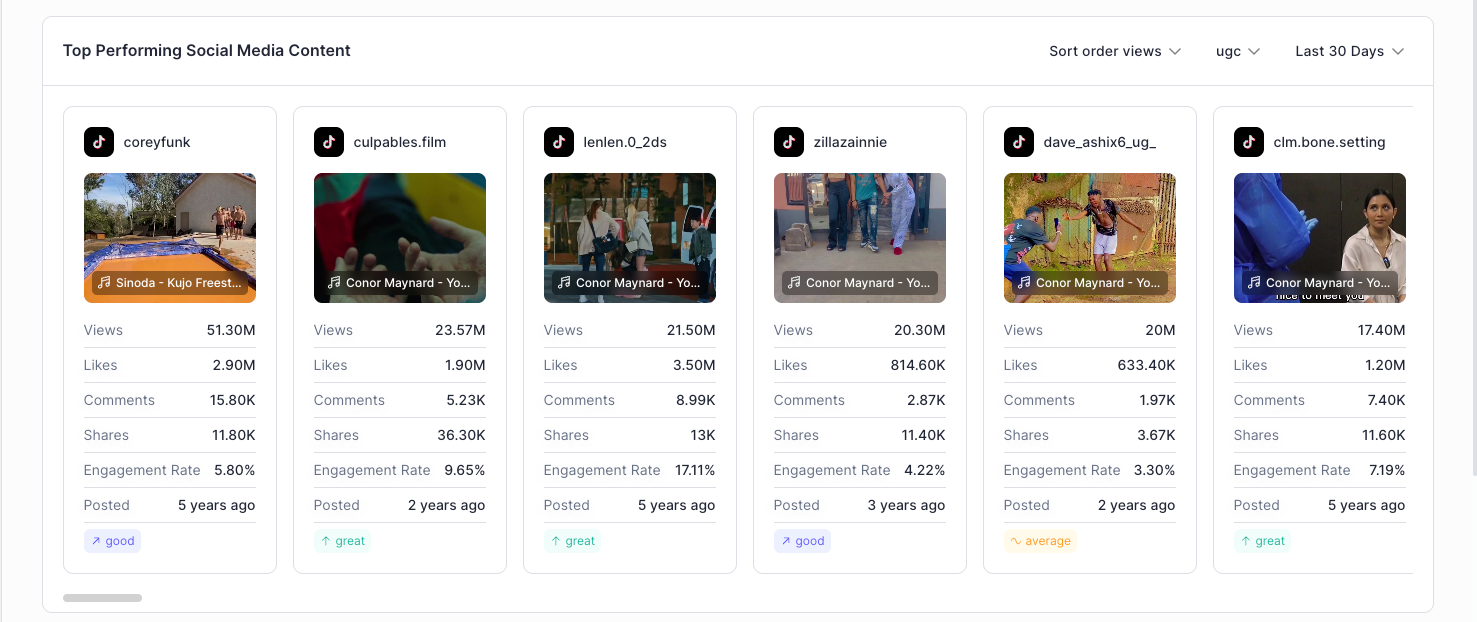
🎵 Social Posts Performance
The social content view shows the latest and top-performing TikTok and YouTube posts connected to your artists' tracks. Each piece of content is benchmarked against the artist's own engagement baseline, so you can separate signal from noise.
Click on any tile to view the content directly on the platform.
| Category | What It Means |
|---|---|
| Great | Engagement 25% or more above artist average. Worth paying attention to. |
| Good | 5% to 25% above average. Performing well. |
| Average | Within 5% of baseline. Normal performance. |
| Underperformed | 5% or more below average. Low traction. |
This tells you which content is generating real momentum before you decide where to put promotion budget.
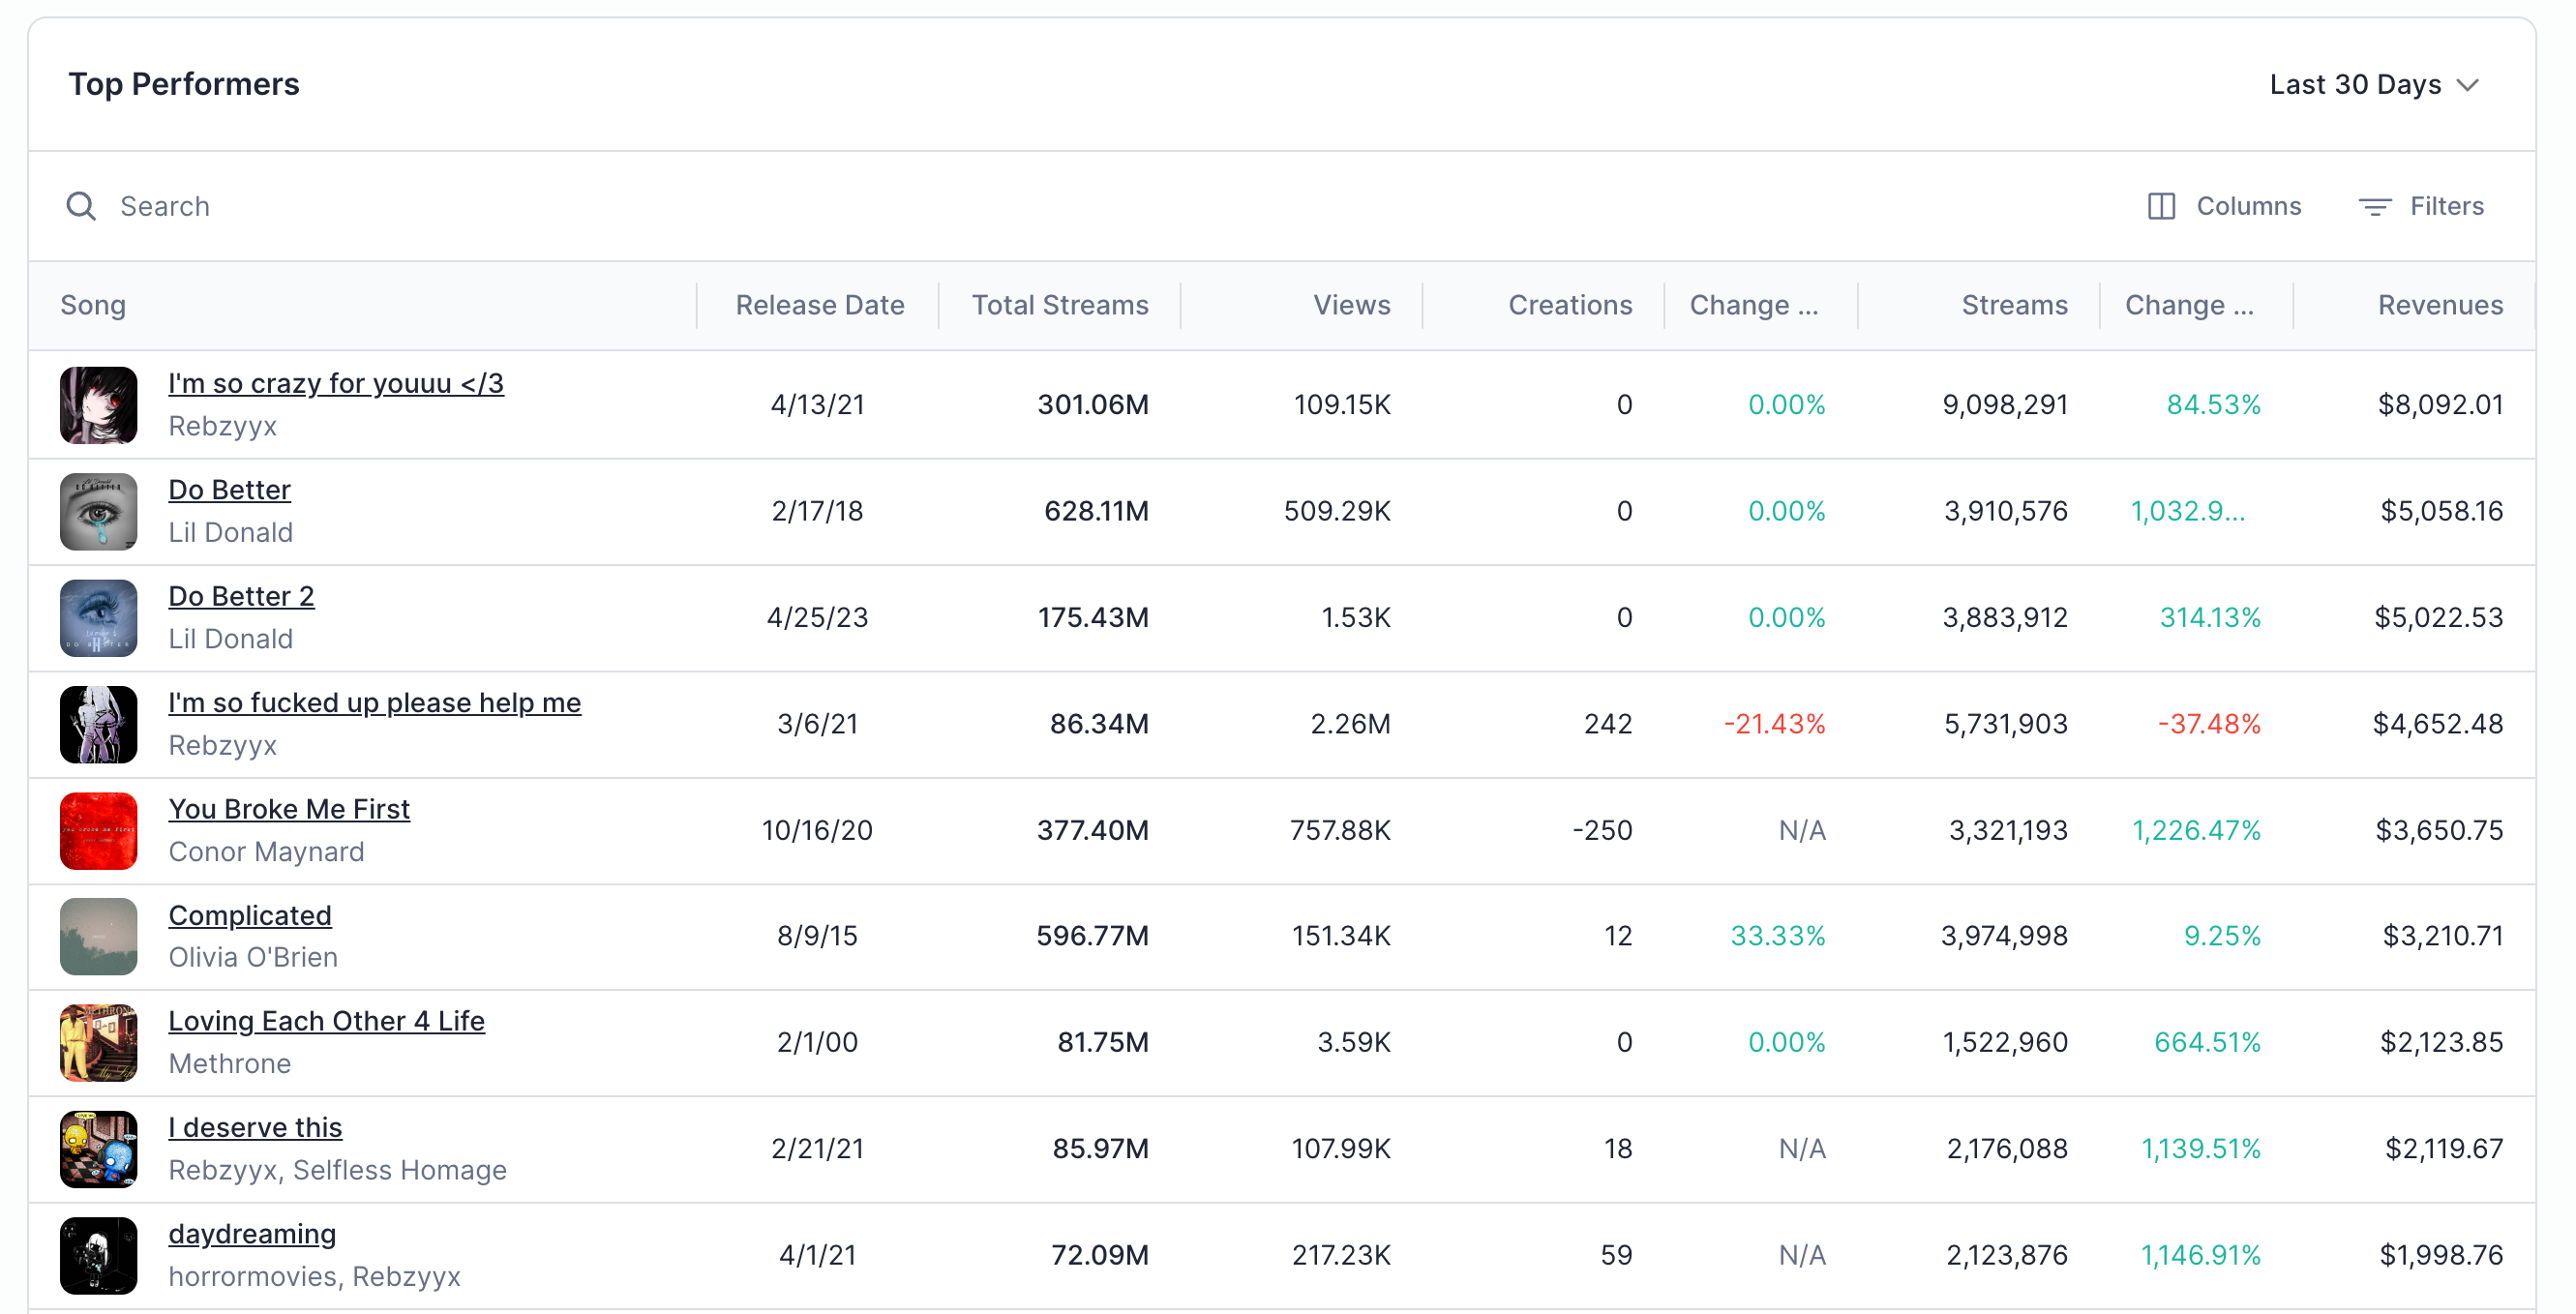
🏆 Top Performers
View and compare the critical data points for the strongest releases across your artists: total streams, views, and revenue side by side. Sortable and filterable, so you can answer questions like "which releases are earning the most" and "which artists are growing fastest" without pulling reports from three different tools.
🔍 Track Details
Drill down into any individual release. Revenue estimates, streaming metrics, social content, and trend lines, all on one screen. Every ISRC you provided has its own detail view.
When you need to evaluate a specific release for a conversation with an artist, a sync, or an internal decision, this is where you go.
How It Works
- You provide a list. ISRCs, UPCs, or Spotify links to Artist Profiles.
- We build the dashboard. Public data is pulled across Spotify, YouTube, TikTok, and Chartmetric. Revenue estimates are calculated. The dashboard is live within 48 hours.
- You get full access. Data updates daily. All views are sortable and filterable, with drill-down from artist level to individual releases.
No data sharing. No long-term commitment required to get started.
Scouting and Artist Evaluation
Dashboards are not limited to your current roster. If you have identified an artist you are interested in, provide their Spotify Artist Link or a set of ISRCs and receive the same level of analysis: revenue estimates, streaming trends, social engagement, and the correlation between the two.
This is especially useful when you have already spotted an artist and want a structured, data-backed view before making a signing decision.
For teams that want to integrate this data into their own systems, we can also provide access via API. This allows you to pull dashboard data directly into your internal tools for further processing, reporting, or modeling.
Questions or Walkthrough
If you want to see a dashboard live, discuss methodology, or have questions about specific metrics, reach out to [email protected].